
Electronic Reports
Electronic Reports help improve corporate performance
VEKTR® electronic reports can help improve your corporation’s performance. When data is collected electronically, results are automatically organized, data results are categorized in report tables and charts indicate trends, that can be modified for better performance.
When audits or inspections are electronically generated by using devices like Pads and smart phones, the answers can be tallied immediately. If for example, one of your questions is: “Has a customer been contacted and greeted within a minute or two after entrance”. Once the audit is synchronized, the results are calculated immediately and imputed for the percentage of “Yes” or “No” responses and stored as data until a report is generated.
When a report is running, it pulls the needed data to input it into a report table, to verify if one or all locations are following this procedure. Corporate wise the data can be analyzed to determine, how many are following the procedure and how many are not. The report can summarize the total results for a company’s total percentage.
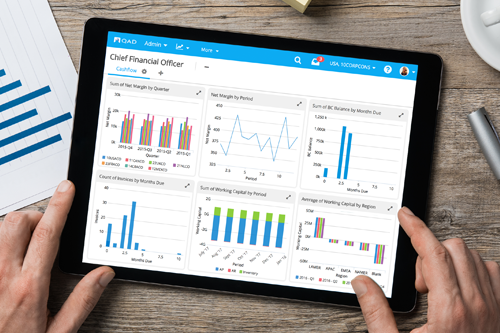
The reports can tract the data, to determine if the procedure is being followed over a specified amount of time. A chart can be produced, to show if the procedure is being followed for the that specific time, through the whole company. The report chart would show the trends, or if the procedure is increasing in corporation, or if it is declining in performance, in the form of a bar chart or a line chart. This would help a corporation to decide if they needed to do some additional training or some other option, to increase customer contact. This could help the customer to have a better experience in the corporation, by making sure their questions get answered, in the beginning of their experience.
VEKTR® electronic reports can help a corporation to improve their performance with their customers. The way the process works is by data collections through pads or smartphones, that automatically organize the information submitted into data tables, once the data is processed a report can be run to produce a report table. The report can include charts that can indicate current trends. After analyzing the charts, corrections can be put in place to produce improved performance of the corporation to the customer.